Welcome to the Dedaub AI Custom Monitoring Beta
Thank you for your interest in participating in our Beta Program.
This beta gives you early access to a simpler way to build custom onchain invariant checks. Define safety and property checks for your project using natural-language specifications, and the Dedaub AI Query Builder will generate monitoring queries for you to review, refine, and deploy—without needing deep knowledge of DedaubQL or Dedaub's data structure.
Choose your path: use the guided Web App for a no-code setup, or use the CLI with your AI coding agent for a developer workflow.
What we'd like to see from you
Choose your beta experience
Web App (no-code)
Describe your protocol in a form, let Dedaub draft starter alerts, review, and go live — no command line.
CLI + AI agent (developer)
Install the skill into your coding agent, describe what to watch in plain English, and let it draft, validate, and deploy the query.
Use the Web App if you want a guided, no-code setup.
Best for: protocol teams that want to describe their monitoring goals in a form, review suggested monitors and go live without using the command line.
| Item | Why it matters |
|---|---|
| Protocol name | Required to start the flow. |
| Chains | The assistant will not guess the network. |
| Contract address | Use a router, vault, multisig, proxy or deployer. |
| Monitoring goal | One clear event or threshold works best. |
- Describe what you want to protect.
- Give Dedaub a clear monitoring goal.
- Review the drafted monitors.
- Test the results.
- Deploy the monitor when you are comfortable with it.
Use the CLI if you prefer a developer workflow.
Best for: developers who want to work from the terminal, use an AI coding agent and validate generated DedaubQL before deploying.
| Item | Why it matters |
|---|---|
| Dedaub app account | Required for Monitoring beta access. |
dedaub-monitoring | Lets the agent create, write, validate and run queries. |
| AI coding agent | Claude Code, Codex, Cursor or the universal .agents target. |
| Protocol name | Required to define the monitoring scope. |
| Chains | The assistant will not guess the network. |
| Monitoring goal | One clear event or threshold works best. |
- Install the Dedaub Monitoring skill.
- Describe what you want to monitor.
- Let the agent draft the query.
- Validate and inspect the query plan.
- Deploy the monitor when you are comfortable with it.
Web App onboarding flow
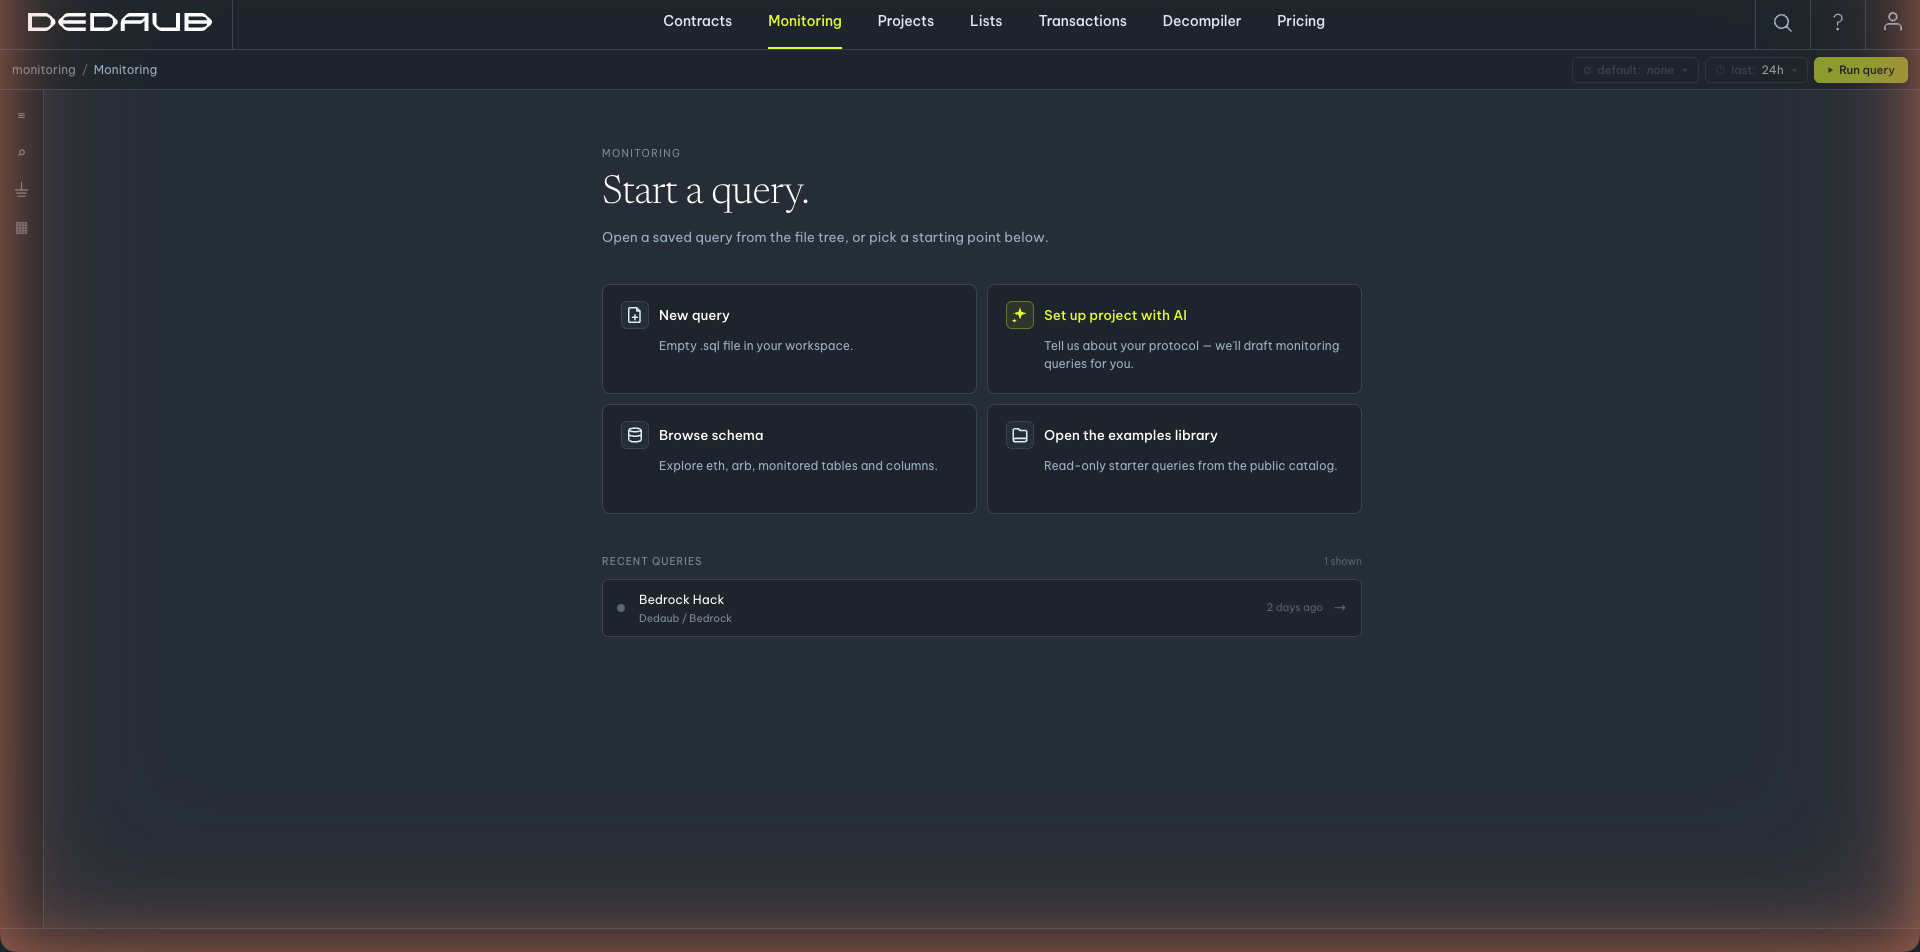
Open the monitoring app
Navigate to app.dedaub.com/tx-monitor. Sign in if you already have an account, or sign up if you do not. This is the monitoring workspace and the starting point for setting up your first monitor.
Describe what you are protecting
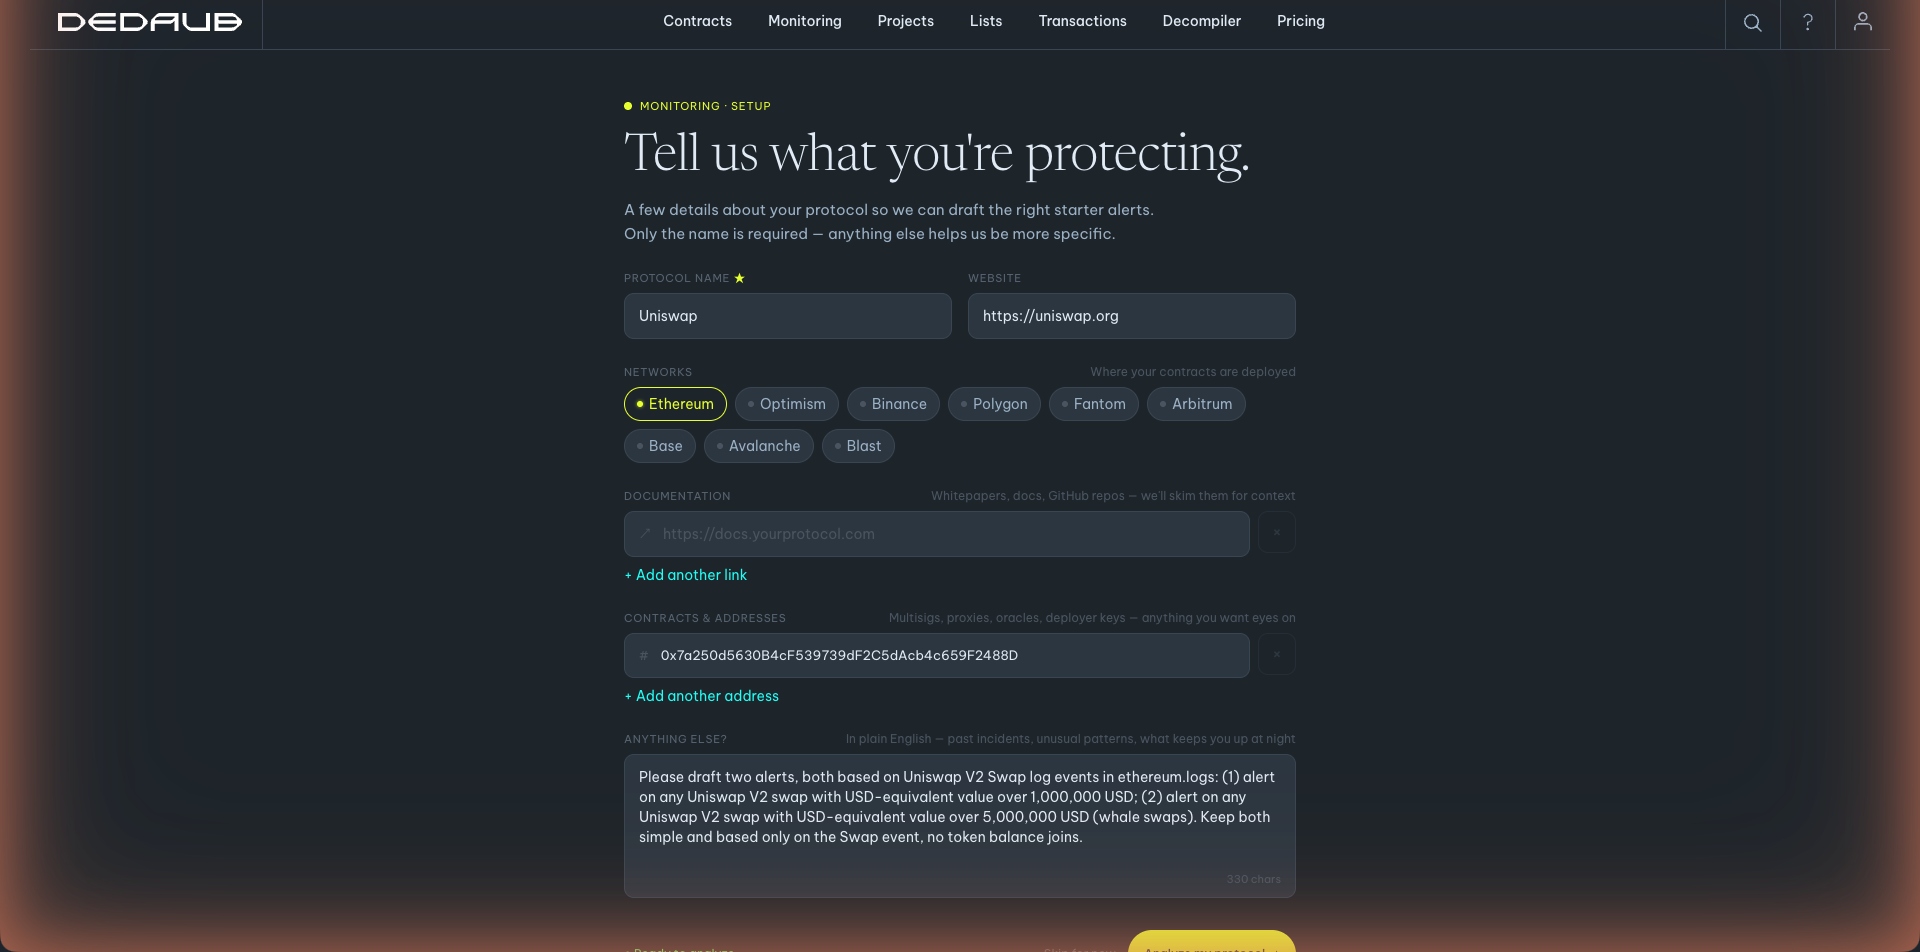
Open app.dedaub.com/monitoring/onboarding. Fill the form under Tell us what you are protecting.
| Protocol name | Required. Example: Uniswap. |
|---|---|
| Website | Optional. Example: https://uniswap.org. |
| Networks | Click each chain you deploy on. This run used Ethereum. |
| Documentation | Optional links (docs, GitHub). The engine skims them for context. |
| Contracts & addresses | Multisigs, proxies, oracles, routers, deployer keys. This run used the Uniswap V2 Router02 0x7a250d5630B4cF539739dF2C5dAcb4c659F2488D. |
| Anything else? | Plain-English notes on what to watch. This drives the drafted alerts most strongly. |
When you have a name plus an address or about 20 characters of context, the footer shows Ready to analyze and the Analyze my protocol button activates.
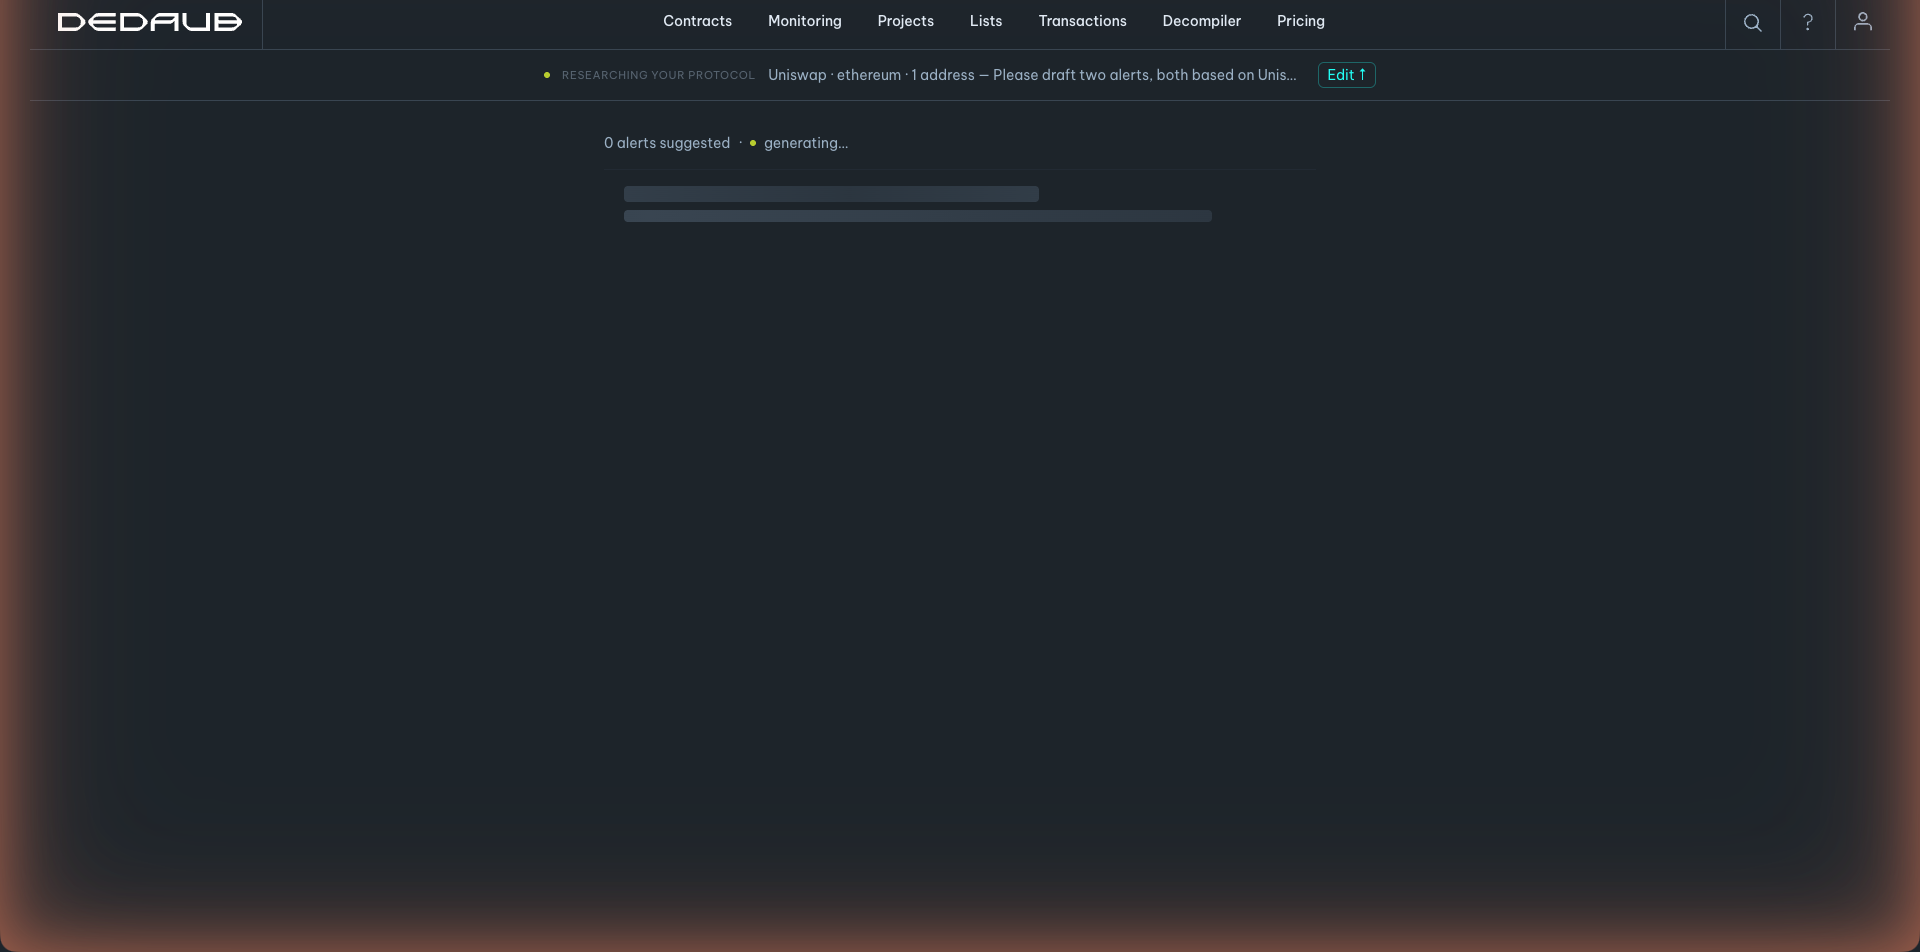
Analyze (researching and generating)
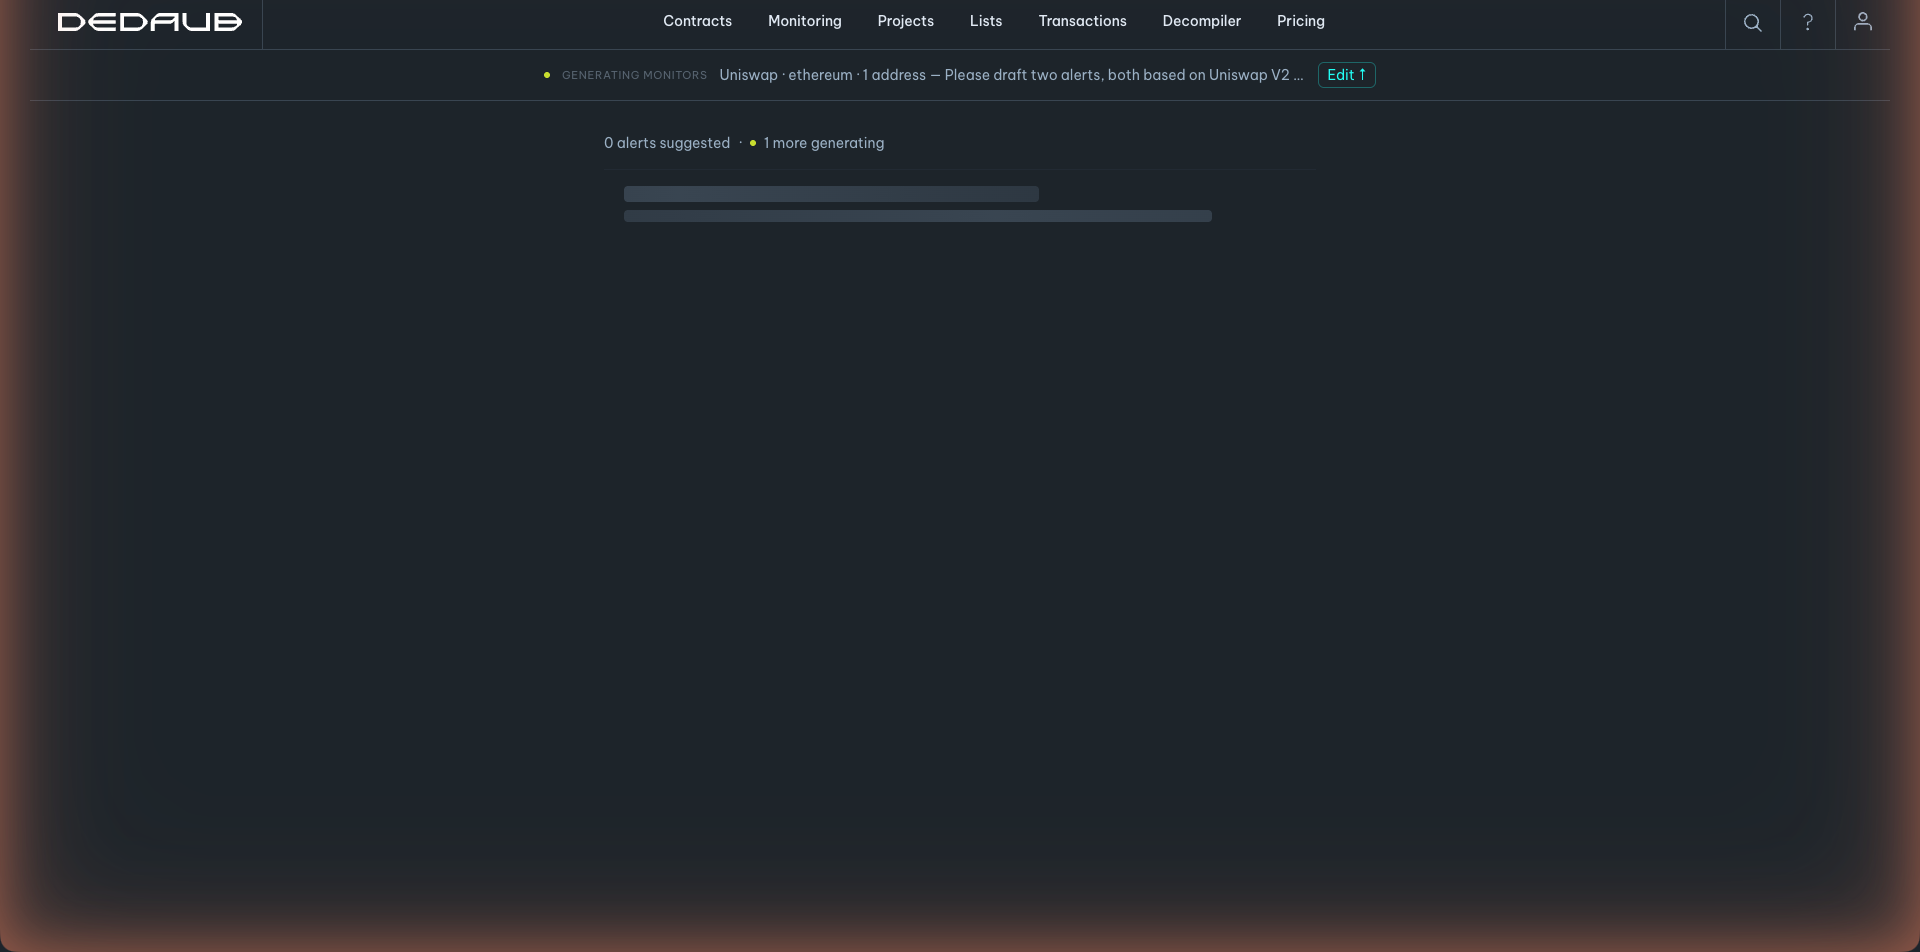
Click Analyze my protocol. The flow moves through two phases: Researching your protocol, then Generating monitors. It reasons about the addresses and your notes, then drafts alert logic.
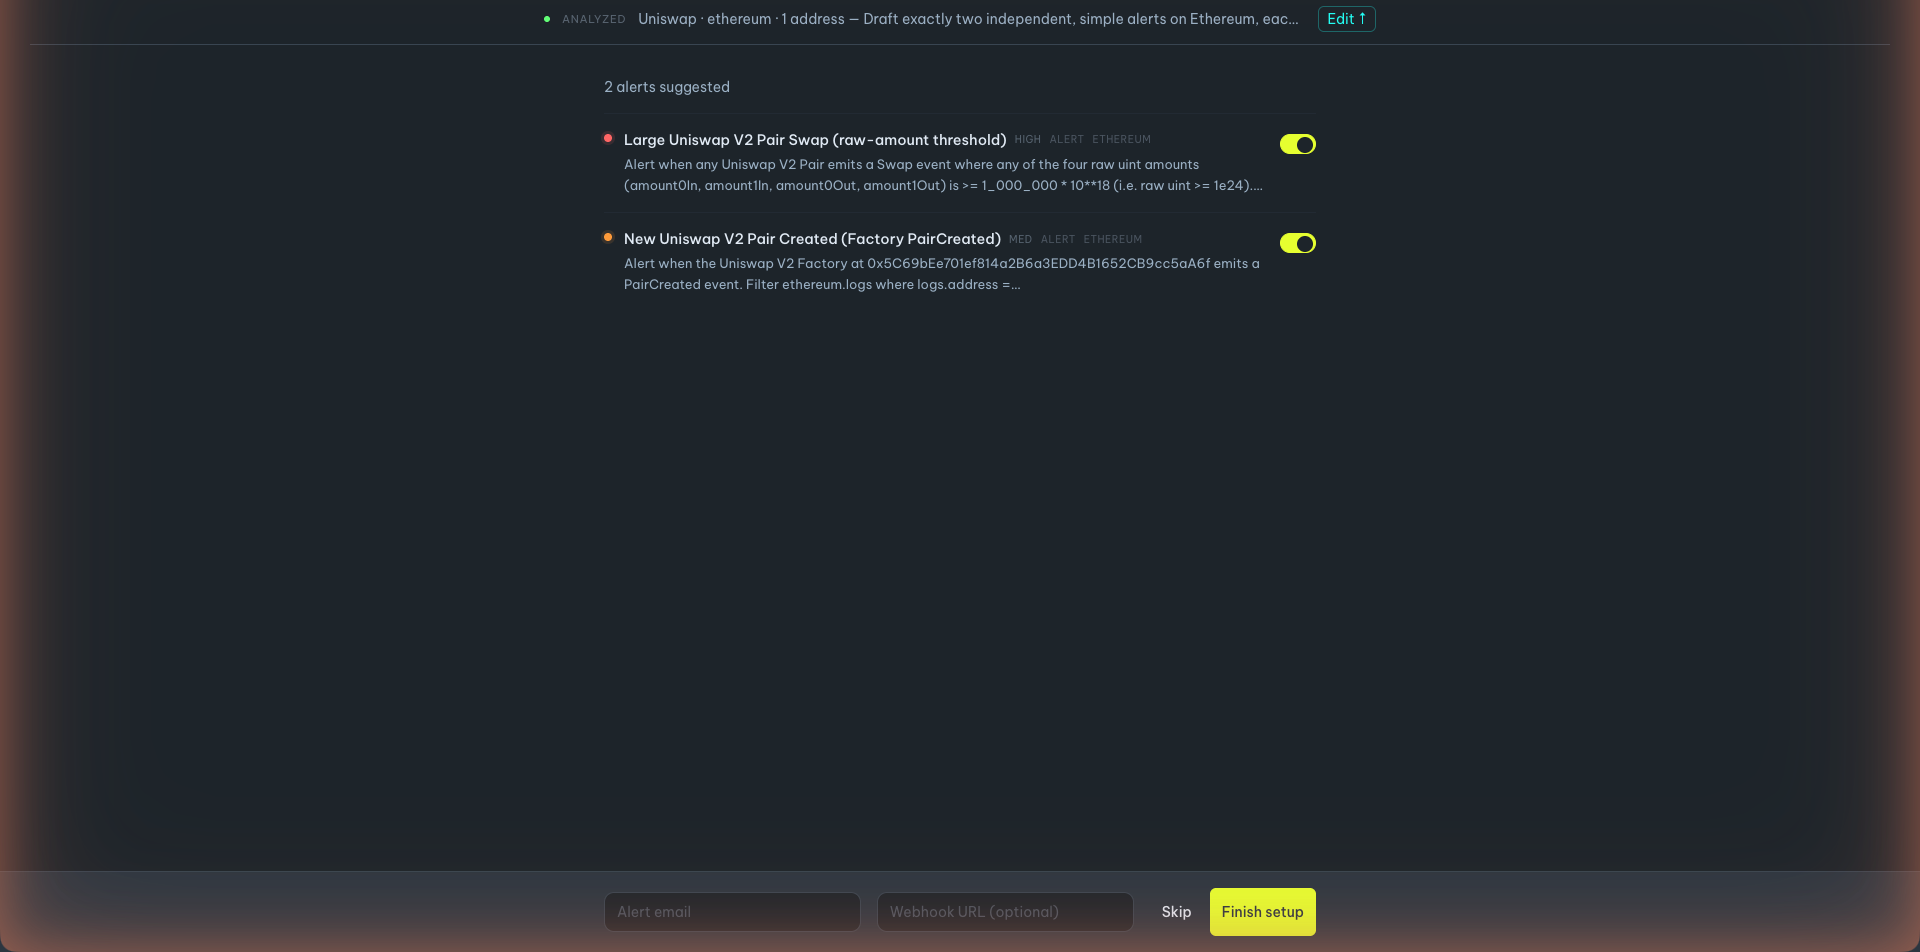
Review the suggested monitors
When drafting finishes, the header switches to Analyzed and each suggested alert is shown as a card with a severity tag (MED or HIGH), the chain, a toggle, and a description of exactly what it detects. A valid card has its toggle on and no error label. Use Edit (top right) to change your brief and re-draft.
Finish setup and go live
Click Finish setup. Saved monitors become live immediately and begin watching new blocks; first results land in your activity feed within minutes.
CLI + AI agent flow
Look at what the CLI can do
Run dedaub-monitoring --help to see the full command set. Everything the skill does later maps to one of these commands, so it is worth a glance up front.
$ dedaub-monitoring --help
Dedaub Monitoring CLI

Commands
  login            Authenticate via browser (OAuth2 Device Flow).
  logout           Remove stored credentials for a profile.
  entities         List entities (user + orgs) available to you.
  tree             Show the query file tree for an entity.
  create-folder    Create a folder.
  create-query     Create a new empty query.
  write-query      Update the SQL text of a query.
  get-schema       Show available tables and columns.
  run-query        Execute a query and print results.
  validate-query   Fast compile check.
  explain-query    Print the query's real PostgreSQL EXPLAIN plan.
  install-skill    Install the dedaub-monitoring skill.
  webhook          Manage notification webhooks.
alert-filter Manage saved alert filters.Install the Dedaub Monitoring skill
Run dedaub-monitoring install-skill. The installer lists every agent it detects on your machine. Use the arrow keys to move, enter to toggle a target on or off, then submit.
$ dedaub-monitoring install-skill
Install the dedaub-monitoring skill to:
↑/↓ move · enter toggles · Submit + enter to finish

○ Claude Code         ~/.claude/skills/dedaub-monitoring · detected
○ Codex               ~/.codex/skills/dedaub-monitoring · detected
○ Cursor              ~/.cursor/skills/dedaub-monitoring
○ Universal (.agents) ~/.agents/skills/dedaub-monitoring
Select your agent (here, Claude Code) and confirm. The skill is installed as a SKILL.md plus a references/ folder.
√ dedaub-monitoring installed to 1 agent (SKILL.md + references/)
• Claude Code ~/.claude/skills/dedaub-monitoringOpen your agent and trust the workspace
Launch your agent in the project folder — for Claude Code, just run claude. On first launch the agent asks you to confirm the workspace is one you trust. Choose Yes to continue.
$ claude
Claude Code v2.1.168

Welcome back!

Quick safety check: Is this a project you created or one you trust?

  1. Yes, I trust this folder
  2. No, exit

Enter to confirm · Esc to cancel
Start the skill and authenticate
Invoke the skill with /dedaub-monitoring. It runs a quick session setup, which includes checking your authentication by listing the entities available to you.
/dedaub-monitoring
I'll start with session setup, then find out what you'd like to monitor.

Bash(dedaub-monitoring entities | head -40)

Name    ID
+7 lines (ctrl+o to expand)

You're authenticated. Now tell me what you'd like to do.
Describe what to monitor
The skill asks for the core spec: the protocol or asset plus the event or threshold. It offers concrete examples of the shape it expects, then asks whether you want a one-off query or a deployed alert.
What onchain activity do you want to track? Include the
protocol/asset + the event or threshold. For example:

  - "USDC transfers over $1M on Ethereum"
  - "Aave v3 admin/role changes"
  - "Morpho liquidations on Base"
  - "Top swap volume by pool on Arbitrum over the last day"
In this run the request was a single, simple line:
> Create a query that tracks swaps that are worth more than 1m dollars in Uniswap v2Pick a network and let the skill gather references
The skill confirms the mode (query vs. deployed alert), then reads its bundled reference material — the patterns hub, the Uniswap V2 reference, and the macro set — before asking the one thing it cannot infer: the network.
Query mode it is. Let me gather the schema and Uniswap
reference material before asking you about network.

Searched for 1 pattern, listed 1 directory · Read 3 files

Which network(s) should this query cover for Uniswap V2
swaps ≥ $1M?

> Ethereum
Ethereum).Create, write, validate, and run the query
With the network fixed, the skill verifies the exact columns and the USD-valuation primitive, then drives the CLI end to end. It leads with the Swap topic0, joins contracts to keep only pairs deployed by the Uniswap V2 factory, excludes forks that share the same Swap signature, then values each swap's token legs via token_ledger and to_usd_value. Then it creates the folder and an empty query.
Bash(dedaub-monitoring create-folder "/Swaps-UniswapV2-Ethereum"; \
     dedaub-monitoring create-query "/Swaps-UniswapV2-Ethereum/Query")
Created 1 folder(s).
----
Created query (id: 9260).
It writes the SQL into the query by id, then runs the two free checks: a compile-time validation and the PostgreSQL EXPLAIN plan, to confirm the query is valid and leads on indexes rather than sequential scans.
$ dedaub-monitoring write-query --id 9260 <<'SQL' ... SQL
Query updated.

$ dedaub-monitoring validate-query --id 9260
√ valid

$ dedaub-monitoring explain-query --id 9260
Nested Loop Left Join (cost=8134987.16..8293809.86 rows=1)
  -> Hash Join ... leads on index, not Seq Scan
validate-query is a fast compile check and explain-query prints the real query plan without running the query. Use both before run-query to catch errors and spot sequential scans cheaply, especially on large tables like token_ledger.See the result in the app
The work shows up in the app at https://app.dedaub.com/tx-monitor. The skill's spec is turned into one or more suggested alerts, each with a severity tag, the chain, and a precise description of what it detects.
https://app.dedaub.com/tx-monitor

GENERATING MONITORS
Uniswap · ethereum · 1 doc
1 alert suggested • 1 more generating

Alert: Large single-transaction ERC20 outflow
HIGH · ALERT · ETHEREUM
From here you open the monitor in the workspace, run it over a recent window, and review how often it would have fired before relying on it.
Command reference
| Command | What it does |
|---|---|
install-skill | Install the dedaub-monitoring skill into a detected agent (Claude Code, Codex, Cursor, or universal .agents). |
login / logout | Authenticate via browser (OAuth2 device flow) / remove stored credentials for a profile. |
entities | List the user and organizations available to you. Used as the auth check at session start. |
tree | Show the query file tree for an entity. |
get-schema | Show available tables and columns. Used with --network and --table. |
create-folder / create-query | Create a folder / create a new empty query (returns a query id). |
write-query --id | Update the SQL text of an existing query by id. |
validate-query --id | Fast compile check — free, does not run the query. |
explain-query --id | Print the real PostgreSQL EXPLAIN plan — free, does not run the query. |
run-query | Execute the query and print results. |
webhook / alert-filter | Manage notification webhooks / saved alert filters. |